User Documentation
Introduction
IntrAnat is a free database and visualization software for Intracranial Electroencephalographic (iEEG) data that allows to locate and register intracerebral electrodes for individual cases as well as for group studies.
Its goal is to visualize all « imaging » data recorded for neurology patients either in a patient-specific space, or in the MNI space for group studies.
IntrAnat Electrodes is not certified for medical usage !!!!!
Imaging modalities managed by the software are :
MRI images : T1, T2, FLAIR, fMRI results, FGATIR. (fMRI results are the statistics from an fMRI analysis on top of an anatomic MRI).
CT
PET
HomeMade (possibility to load any image calculated in the same referential as the T1)
You can choose three « stages » for the images.
Pre (before any surgery), Post (when the patient has electrodes within the head), PostOp (when the electrodes have been removed and the patient had a resection)
In development : Visualizing EEG and sEEG data.
The only requirement of the software is a 3D T1 MRI (isotropic voxel, approximately 1 mm³ resolution).
All other images can be loaded or not, and be isotropic or not.
IntrAnat is composed of three interfaces.
ImageImport for data importation (Nifti images, patient information, coregistering images, running T1 segmentation, image registration and MarsAtlas parcels calculation)
locateElectrodes for patient data visualisation, electrodes positioning, « second step » processing (resection, ROIs, …).
groupDisplay for group studies (in the MNI space).
The image format used by IntrAnat Electrodes is NIFTI (.nii or .img and .hdr).
If your images are in dicom format, you have to convert the files (using e.g. MRI Convert (http://lcni.uoregon.edu/~jolinda/MRIConvert/) or dcm2nii (https://www.nitrc.org/plugins/mwiki/index.php/dcm2nii:MainPage)
IntrAnat Electrodes was mainly developed for Deep Brain Stimulation (DBS) and epilepsy electrodes visualization onto MRI, CT and PET images. This is what guided the GUI and functions of the software. Even if its use is not limited to that, it oriented the software development and may be less user-friendly for others uses.
The software runs on Linux operating system (developed under Ubuntu 14.04 to 20.04). Some libraries it uses do not run correctly on Windows and Mac OS X but IntrAnat itself should work on those platforms.
Running the software
Please follow installation instruction, then run the appropriate script:
ImageImport.sh
locateElectrodes.sh
groupDisplay.sh
 ImageImport :
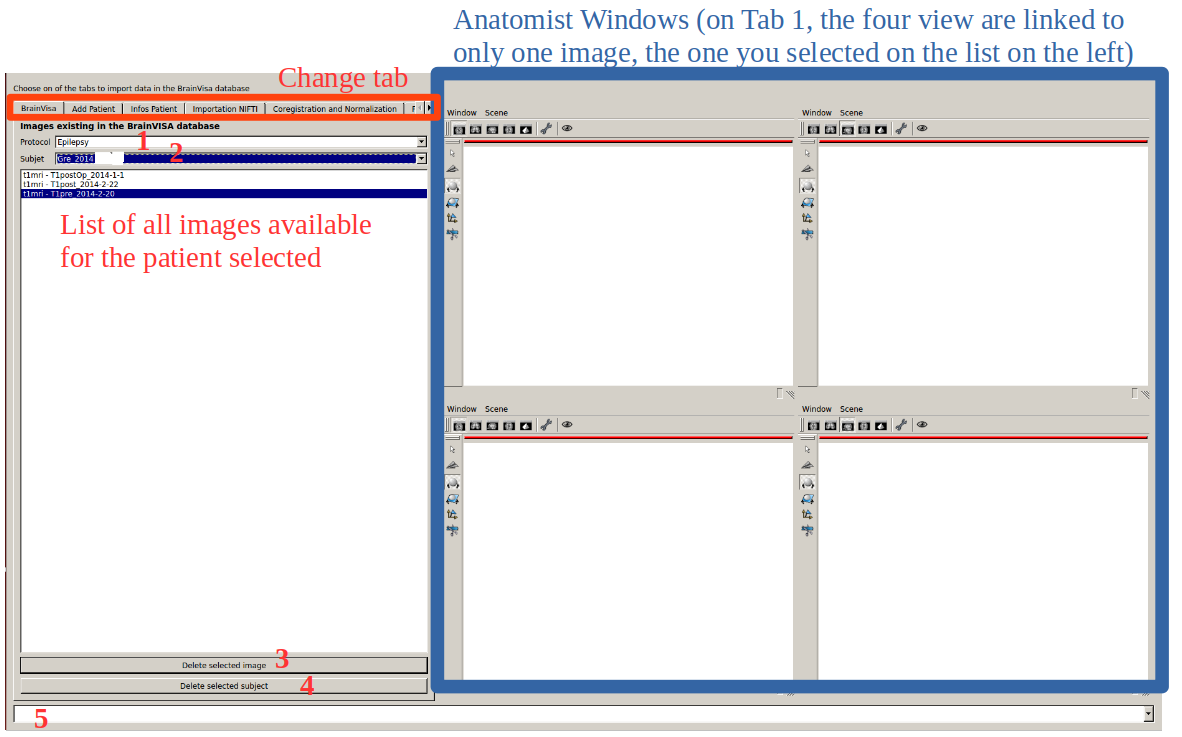
Tab 1: on startup, the first Tab is displayed : it shows the list of images and patients in the database and allows to delete images/patients.
1 Select protocol (epilepsy, OCD, parkinson, …) which corresponds to a folder within the database
2 Select the patient (which has to be added using the Tab 2)
3 Delete the image selected (in this case : t1mri-T1pre-2014-2-20)
4 Delete the subject selected (in this case : Gre_2014_anonymous)
5 Confirmation Bar. For some functions, it will inform the user when a process is finished
Anatomist display Windows :
Anatomist Windows are not made by IntrAnat Electrodes Developers. Documentation for their interface is online (http://brainvisa.info/anatomist-4.5/user_doc/anatomist_tutorial.html)
Basically :
all windows are synchronized, this means that if you click at one point of the space in one, it will update the other windows to show the same position. You can move around using the middle click (combined with shift and control keys).
In the Windows menu, you can save the image currently displayed and save movies.
In the Scene menu, you have options to configure the display. In Scene->Tools, there is an option to enable/disable the cursor if you want to do screenshots for a presentation.
Tab 2 : Add patient
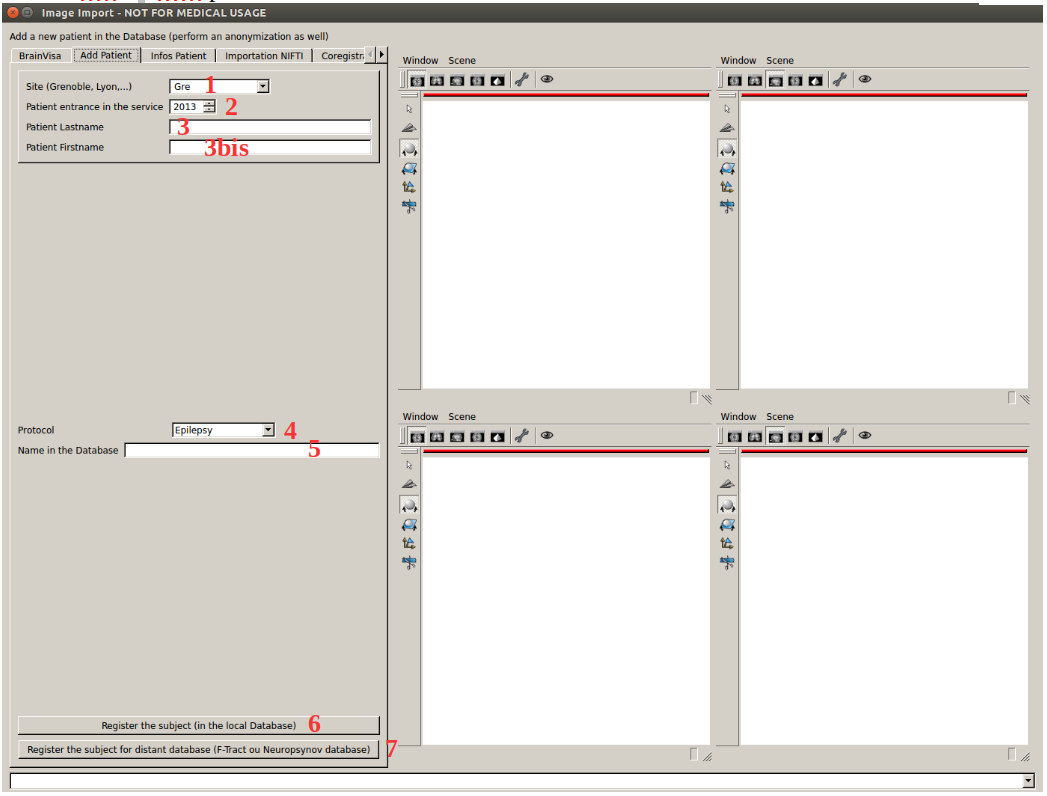
1 Select the Center performing the patient surgery/treatment. This is editable, you can type in a new one, it will be available in the list next time.
2 Select the year when the patient started to be followed in the service (often we put the year of electrodes implantation)
3 and 3bis enter the patient lastname and firstname, they are used to compute the name in the database (different modes available, see preferences tab for pseudonymization). You can always type directly the name that will be used in the database in 5.
4 Select the protocol (available protocols are folders created in the local Database, see the part on local Database organization)
5 Name of the patient in the local Database (and then of the patient folder). It is editable in case you don’t like the generated patient name (but in the preferences tab you have to select the appropriate « project ». Some projects require a specific patient name according to an « anonymization » process.)
6 Register the subject in the local Database (see the part on local Database organization)
In the confirmation bar you should have something like that :
 7 (Nonfunctional for now, should be used to push patient data on a
network database by computing a new anonymization)
7 (Nonfunctional for now, should be used to push patient data on a
network database by computing a new anonymization)
Tab 3 : General Medical Information (only in french for now - deprecated)
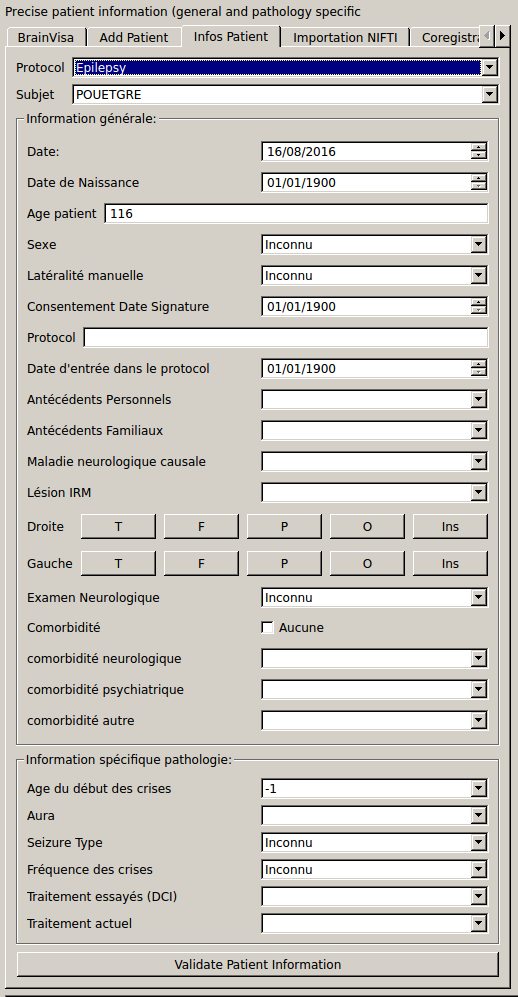
Some of the fields are editable. Type in the item you want, press enter and it will be added to the list. In the database, there is a file containing all new entries, so once you have added one for a patient, the new entries will appear for the next patients.
All information is saved in a file in the database but for now they are not displayed when you reopen the patient (in progress).
Tab 4 : Import Nifti file (it is also possible to import mgz freesurfer file, atlases).
For all patients, the only mandatory (but really mandatory) image is a 3DT1 (isotropic, around 1 mm resolution) without electrodes (prior to electrode implantation). All images are then coregistered to this 3DT1. Morphologist and MarsAtlas processes are run on it by default.
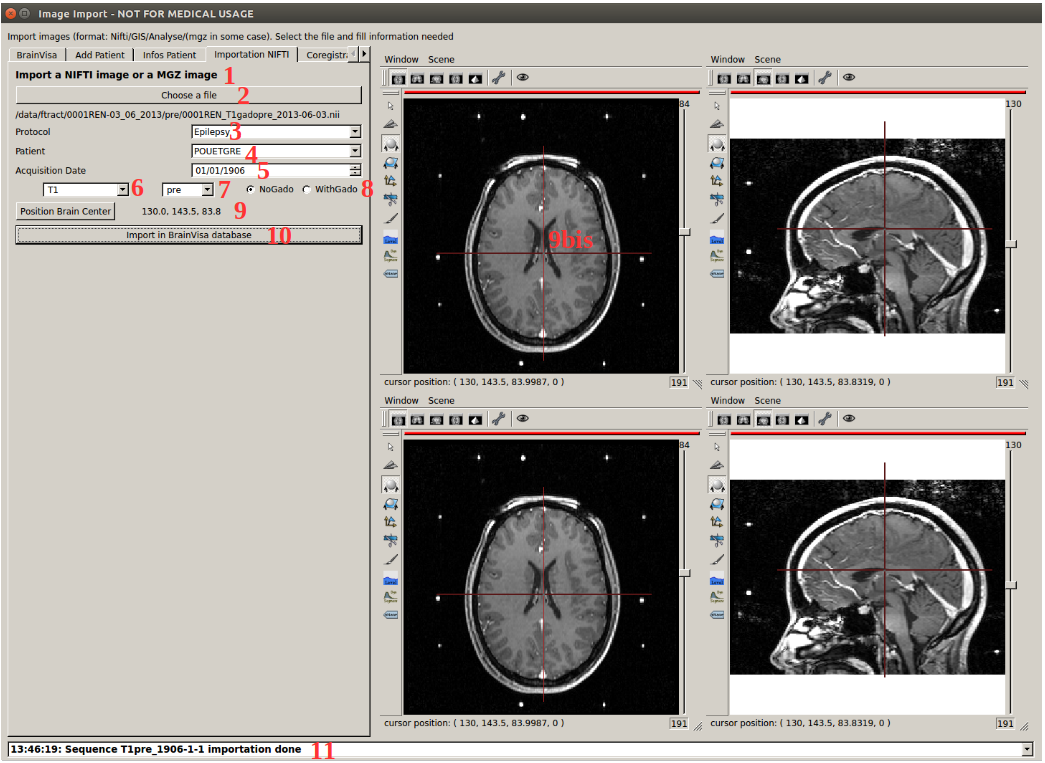
1 software should accept all .nii and .img + .hdr images. It can accept mgz files from freesurfer but it is made only for the filetype fressurfer atlas and hippocampus freesurfer atlas. For freesurfer atlas, it is assumed that atlases have been calculated on the same 3DT1 as the 3DT1 pre previously imported on IntrAnat Electrodes for this patient. This is because freesurfer output images are always 256x256x256 so for the importation we resample the atlases on the 3DT1 pre previously imported.
2 Select the file on your computer (once selected it should have reset the braincenter (9) if one was selected on a previous image loaded)
3 Select the protocol to which the patient belongs (it is a filter to not scroll on the full patient list)
4 Select the patient
5 Select the acquisition date of the image (won’t accept the default date : 01/01/1900)
6 List of all accepted image types.
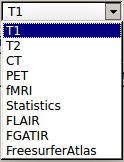
fMRI are results of fMRI, not the raw data. This means it is a RGB image, with in grayscale the anatomical MRI taken during the fMRI sessions with in RGB color the results of the fMRI (activated area, p-value, …).
Statistics are whatever values (like p-values, t-value whatever, where they pass a threshold and zero everywhere else). These « maps » have to be calculated (or resampled) in the T1 pre referential because they will automatically be considered in the brainvisa database as having the same geometry as the T1 pre (matrix size and scanner-based to storage matrix transformation).
FreesurferAtlas is for example a file like the one generated for the Destrieux atlas aparc.a2009s+aseg.mgz
7 three acquisition periods are available. Pre, Post and postOp (as the software was made for epilepsy at the beginning). Pre is before implantation of the electrodes. Post is when the patient has the electrodes (for electrode localizations) and postOp is after the removal of electrodes, and after the surgical resection/cortectomy. For DBS patient, you need to load images only in pre and post period. Don’t save anything as postOp.
8 option available only for T1. Morphologist and MarsAtlas don’t run very well on T1 with gado. So if the T1pre is made with gado, it will use spm to segment grey and white matter, and run Morphologist and MarsAtlas on this segmentation. Results will be linked to the original t1, not the mask. (in development).
9 and 9bis BrainCenter. Some coregistration algorithms need a first step to align the brains of the images. Setting the Brain Center of all images allows to pre-align the images so that the brain matter of images will overlap before running coregistration algorithms. This doesn’t need to be precise, around 2 cm precision is more than enough: example of position on the screenshot above. This step is necessary because the image center of images may be incorrectly set or the field of view of images is too different.
You have to click first on the middle of the brain, approximately, and then on the button « Position Brain Center »
10 Validation button to import the image. A confirmation message should appear as shown in 11. or an error message if a problem happened.
Be Careful !!
If you enter more than one 3DT1 pre. The software will be completly lost. Even if they have two different acquisition date.
You have to make sure that there is only one 3DT1 pre.
For all imaging types, except fMRI and statistics which accept more than one images (with the definition of a subfield), there should be only one image per type. The software for now doesn’t « sort » images by acquisition date, it’s only a user information field.
Tab 5 : Coregistration, estimation of the deformation field for MNI normalization, running Morphologist and MarsAtlas processes
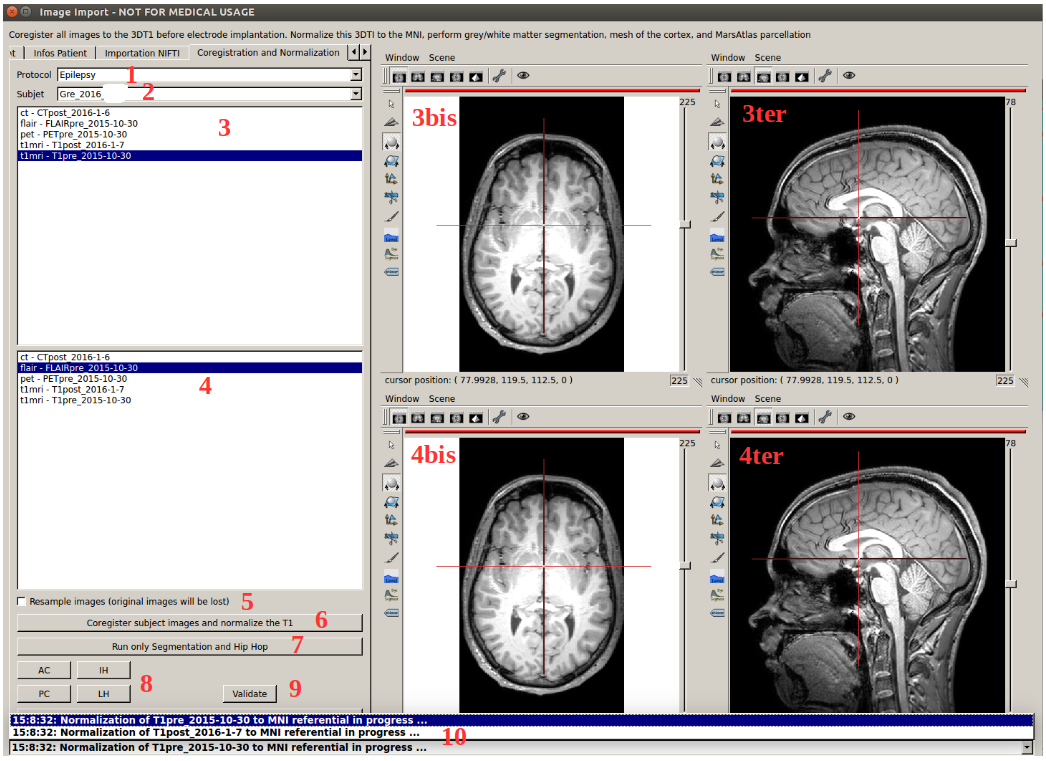
1 Select the protocol to which the patient belongs (it is a filter to not scroll on the full patient list)
2 Select the patient
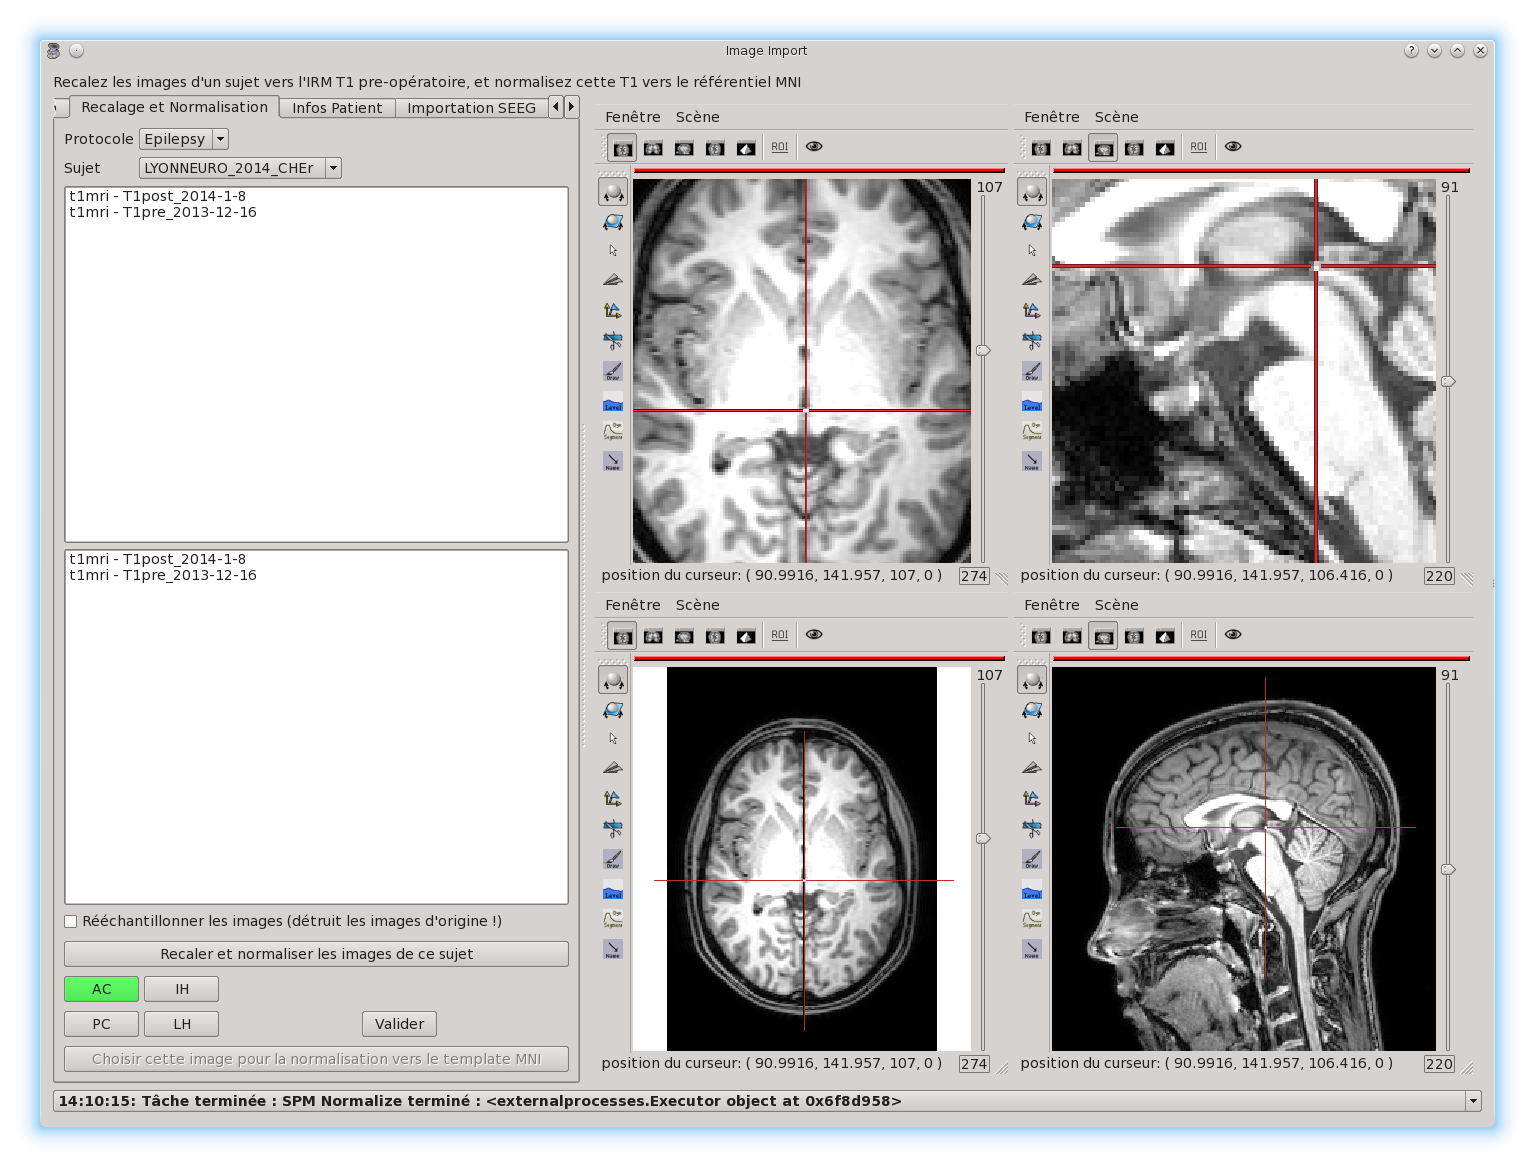
3, 3bis and 3ter: List of all available images. If you double click on one, it will show it on 3bis and 3ter anatomist windows. (http://brainvisa.info/anatomist-4.5/user_doc/anatomist_tutorial.html)
4, 4bis and 4ter : List of all available images. If you double click on one, it will show it on 4bis and 4ter anatomist windows. (http://brainvisa.info/anatomist-4.5/user_doc/anatomist_tutorial.html)
5 this option was « coregister and reslice » of spm. After coregistration of an image to the T1pre, it’s resampling it on T1pre as well. The option was made when using spm8, it has not been updated to spm12. If needed ask IntrAnat developpers.
6 run all processes (on multiple threads) : Coregistration of all images on the T1pre Scanner Based, estimation of the deformation field for normalization into the MNI. Run morphologist and MarsAtlas. To run these two last processes, the software needs to know the position of AC (anterior commissure, PC (posterior commissure), IH (inter hemisphere) and LH (left hemisphere).
So it will shows automatically the 3DT1 pre on anatomist windows on the side and open this message box.
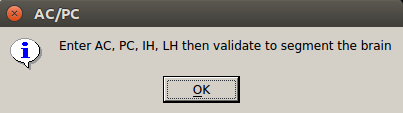 You have to click ok to close it. If you want to run
Morphologist and MarsAtlas you then have to set these points.
You have to click ok to close it. If you want to run
Morphologist and MarsAtlas you then have to set these points.
You have to click on the position of one on the image, for example PC as shown below
 and then click on the button PC in 8. this button will
turn green. So you have to click on the position on the image, and then
click on the corresponding button.
and then click on the button PC in 8. this button will
turn green. So you have to click on the position on the image, and then
click on the corresponding button.
Once all buttons are green, you have to click on validate 9.
The left hemisphere should be on the right side if importation succeded correctly, to check.
Once Morphologist and MarsAtlas are done, in 10 the message HIP HOP : done will appear.
This mean that if you want to run only the coregistration of all images, you click on 6, you click ok on the opening message box. But you don’t precise AC, PC, IH and LH and of course you don’t validate the positions as you haven’t entered them. Only the coregistration will run in this case.
7 If you don’t want to recalculate the coregistration matrix and normalization estimation, but want to run Morphologist and MarsAtlas. (if the coregistration was tricky it is nice). It will open the message box saying that you have to enter AC, PC, IH and LH, as in point 6, and you have to proceed the same way.
8 button to precise AC/PC/IH and LH (see point 6 and 7)
9 Validate the position of AC, PC, IH an LH that you entered to run Morphologist and MarsAtlas.
10 update of processes started and finished. Display for example when a coregistration finished. Display as well when morphologist and maratlas finished (message Hip Hop : done)
Tab 6 : Preferences
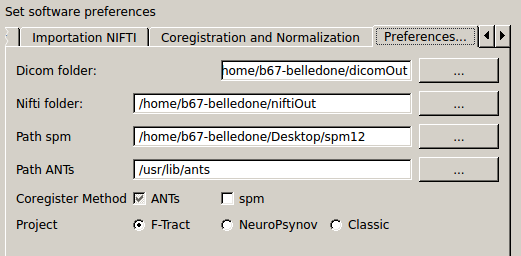 Set the software preferences.
Dicom folder and Nifti folder are useless for now. The dicom importation is not finished yet.
Path SPM : set the path to the main folder of SPM12 (IntrAnat is compatible only with SPM12. Compatibility with SPM8 is not maintained due to lack of time). If not set, you can’t run coregistration using SPM, compute the deformation field to the MNI, or compute MNI position of the electrode contacts etc …
Path ANTs : set the path to the main folder of ANTs. If not set, can’t run coregistration using ANTs.
Coregister Method : either ANTs or SPM. If ANTs is selected you have to run ImageImport in the Seeing Mode (see part one of the user documentation).
Project : it changes the Patient name in tab 2, object 5. Using project NeuroPsynov or Classic for example, the patient name is « Center »_« year »_« Three first letters of the lastname in capital »« first letter of the firstname in lower case ».
for example a patient name John Smith, implanted in Grenoble in 2013, his patient name will be :
Gre_2013_SMIj. And that will be the name of its folder in the database as well.
(/…/BrainVisaDatabaseFolder/Protocol/Gre_2013_SMIj).
Tab 7 : SEEG data Importation (only in french for now, in development)
We open sEEG data using the python-neo toolbox : https://github.com/NeuralEnsemble/python-neo
for now the only option available to users using sEEG data is for the groupDisplay. Instead of displaying all contacts of all electrodes, you can display only contacts which has been recorded.
Other options using sEEG data are not available to users for now.
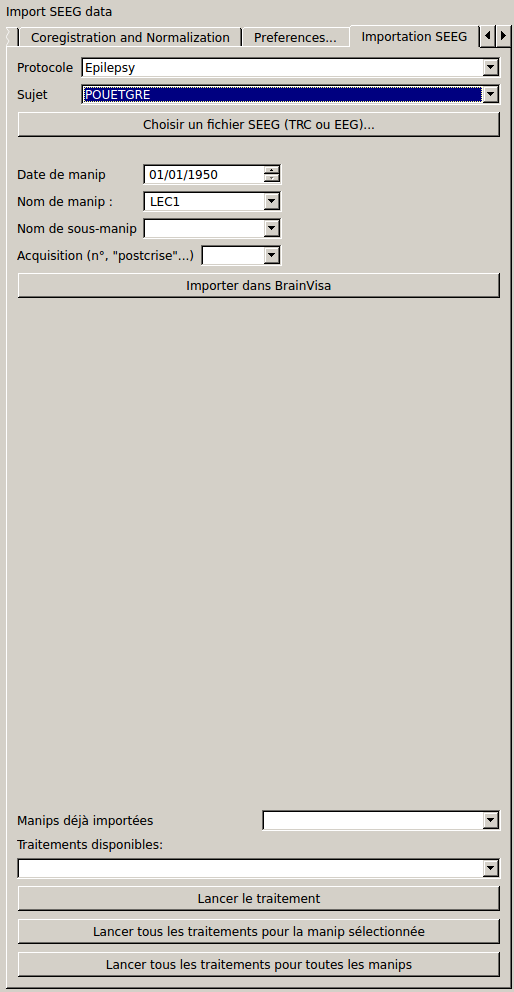 You have to select the patient, give an experiment name (in
the example it’s lec1), you can give a subexperiment name and an
acquisition number but they are not mandatory. And then click on
« importer dans brainvisa ». all others button are useless for now.
You have to select the patient, give an experiment name (in
the example it’s lec1), you can give a subexperiment name and an
acquisition number but they are not mandatory. And then click on
« importer dans brainvisa ». all others button are useless for now.
File Organization from ImageImport
Remember, NEVER DELETE anything in this folder and subfolders. If you want to delete an image or a subject, use button dedicated to that in Tab 1.
If, for any reason, you delete something, you will have to run BrainVisa and perform an Update Database.
In the BrainVisa Database folder that you have specified at the installation you have this :
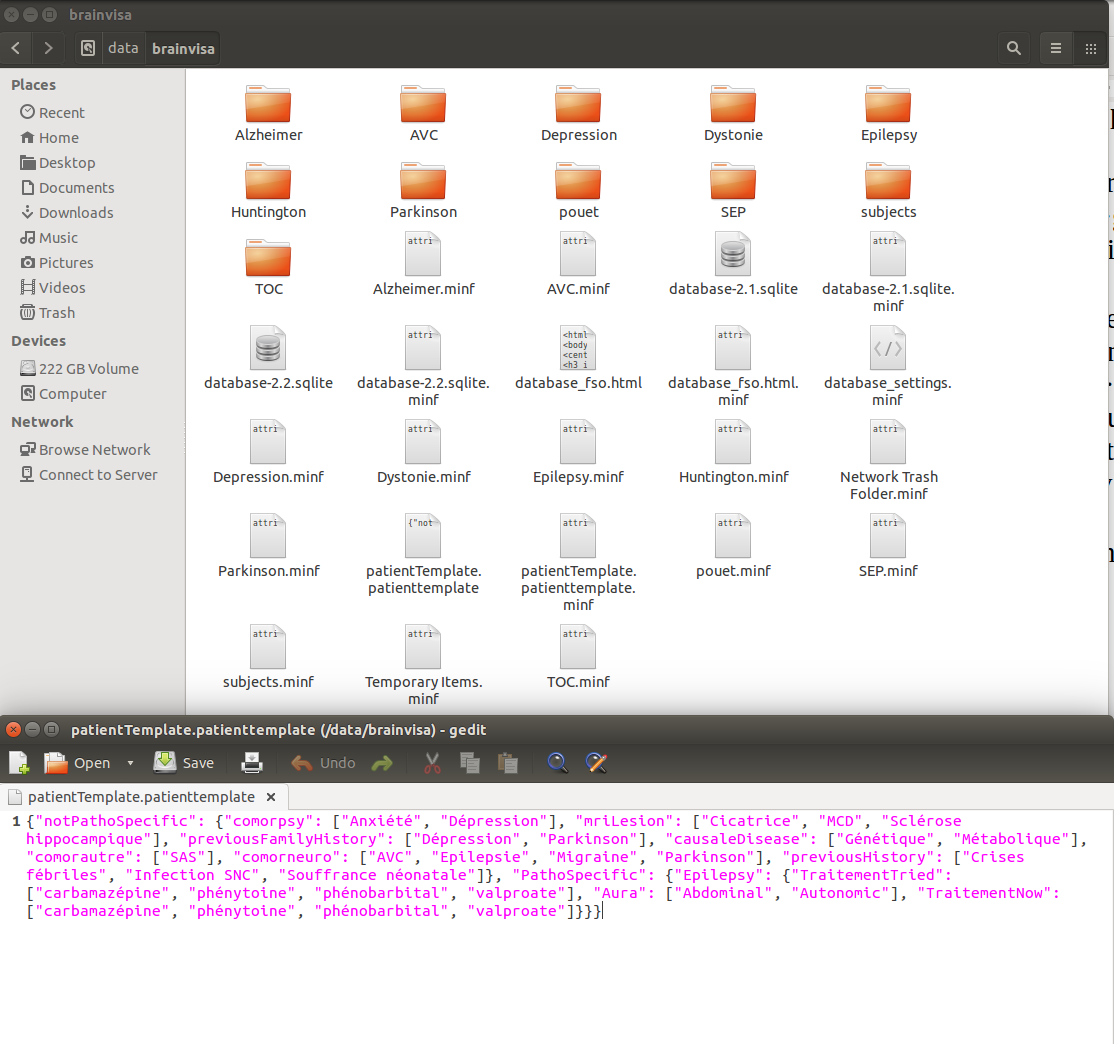 -To add a protocol, you create a folder in the BrainVisa
Database Folder (for example Epilepsy, Parkinson, ….).
-To add a protocol, you create a folder in the BrainVisa
Database Folder (for example Epilepsy, Parkinson, ….).
Then you start BrainVisa, and you perform an update database.
Once it’s done, a file with the same name as the folder with a .minf extension has been created.
-you have a file named patientTemplate.patienttemplate (shown above).
This file is a json file containing a python dictionnary. In this python dictionnary there are all names set as patient general information and pathology speficic information. This is the file that stores all new field types entered manually in Tab 3, and makes them available for the next patients
-In a patient folder, there is a folder for each modality (t1, ct…).
Inside it there is a folder for each acquisition period (pre, post or post op). The image and associated data is inside. There is also a registration folder containing the transformation matrices Scanner-Based to Native and Scanner-Based to T1pre Scanner Based.
If it is the folder of the T1pre, there is also the image normalized to MNI space, the deformation field from the T1pre to the MNI and a folder called « default_analysis » with all files created by the Morphologist and MarsAtlas processes.
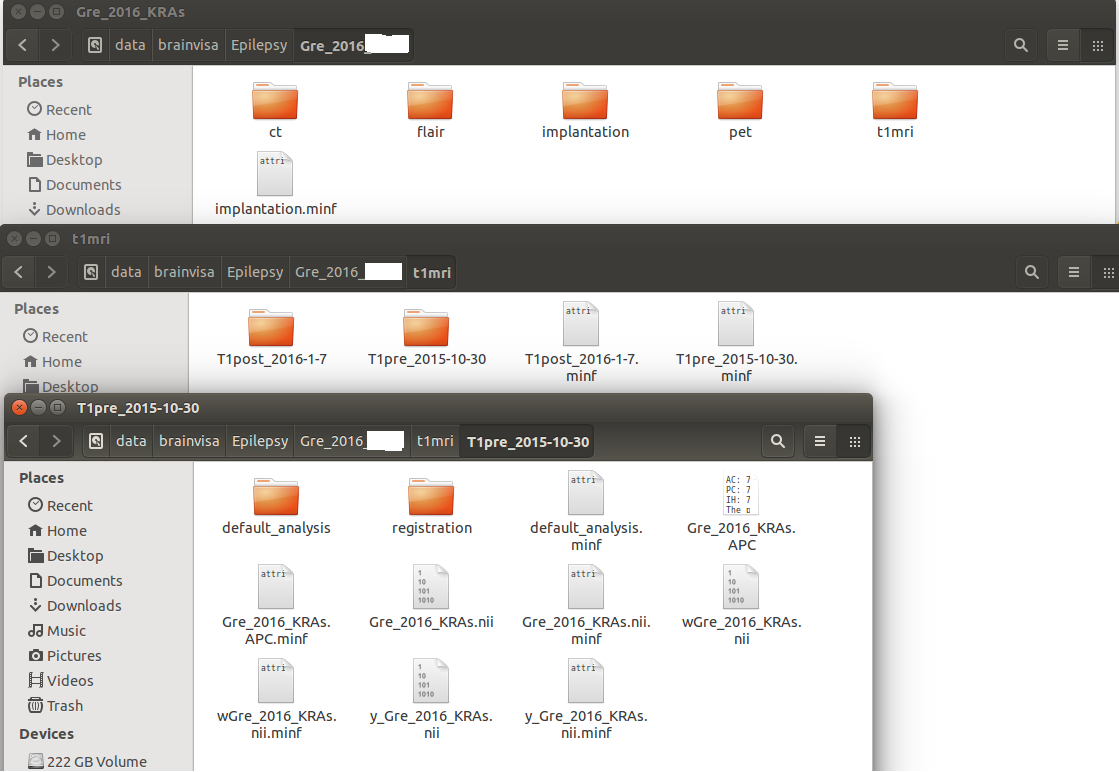 (in this example there is an implantation folder, this one is
generate by locateElectrodes, not by ImageImport. Will see about him in
the locateElectrodes part).
(in this example there is an implantation folder, this one is
generate by locateElectrodes, not by ImageImport. Will see about him in
the locateElectrodes part).
LocateElectrodes
LocateElectrodes is the GUI to visualiaze all imaging data imported using ImageImport, fusion images etc … You can set the position of the electrodes to visualize them on top of all images.
It allows as well :.
Semi-automatic estimation of the resection
Automatic exportation of « dictionaries » containing contacts position information (and center of bipole), their MNI position, mars atlas parcel in which they are (implantation of different atlas in progress) and if they are in the resection or not
Automatic exportation of dictionaries containing the total volume of the resection and percentage of MarsAatlas parcels which has been impacted by the resection (implantation of different atlas in progress - almost done: freesurfer atlases)
Load a patient
Once you open the GUI, you see this :
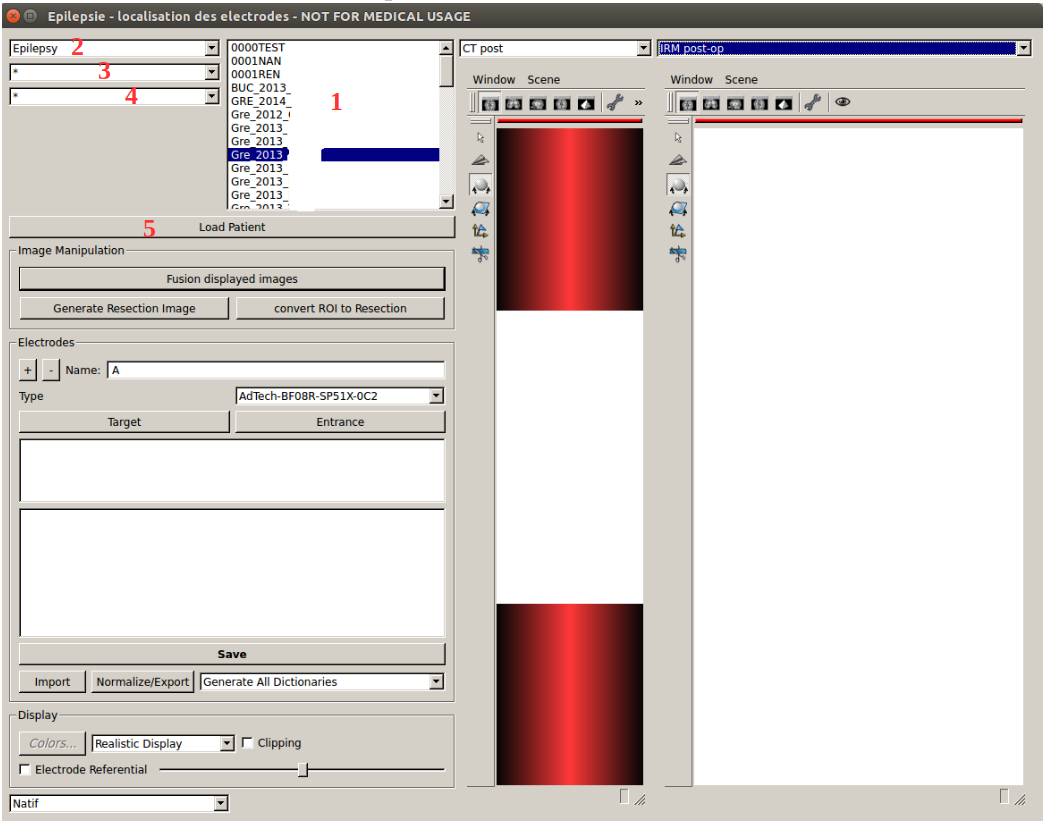
1 List of all patients available, filtered by 2, 3 and 4
2 Select the protocol to which the patient belongs (it is a filter to not scroll on the full patient list)
3 Select the center to which the patient belongs (it is a filter to not scroll on the full patient list)
4 Select the year of patient implantation (it is a filter to not scroll on the full patient list)
for 3 and 4, the symbol « * » means that you don’t filter according to the center or year respectively.
5 Load the patient selected (in blue in 1, you can double click on the patient name in the list as well)
Once a patient is loaded, you cannot load another one.
You have to close the GUI, and close the corresponding anatomist windows (see « closing the GUI » page 3).
Once a patient is loaded
All images available will be selectable in image list such as 1a below (one list for the left anatomist windows and one list for the right anatomist windows).
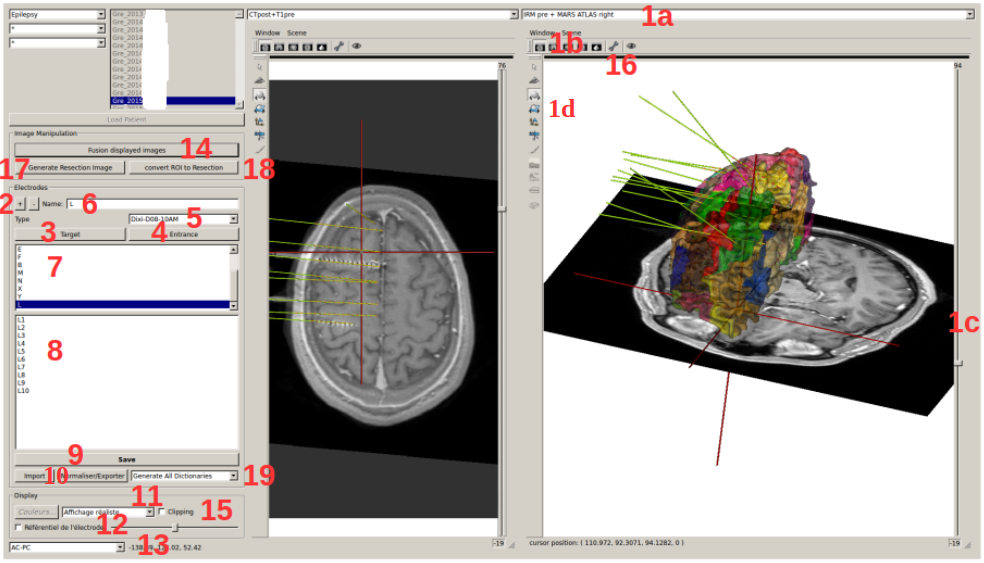
1a, 1b, 1c and 1d : Select an image to display in the anatomist windows below the image list (1a) and manage its display. Anatomist developpers made lot of documentation online (http://brainvisa.info/anatomist-4.5/user_doc/anatomist_tutorial.html). If you leave the mouse few seconds on an icon without clicking, it will display all commands available when you select the icon, for example :
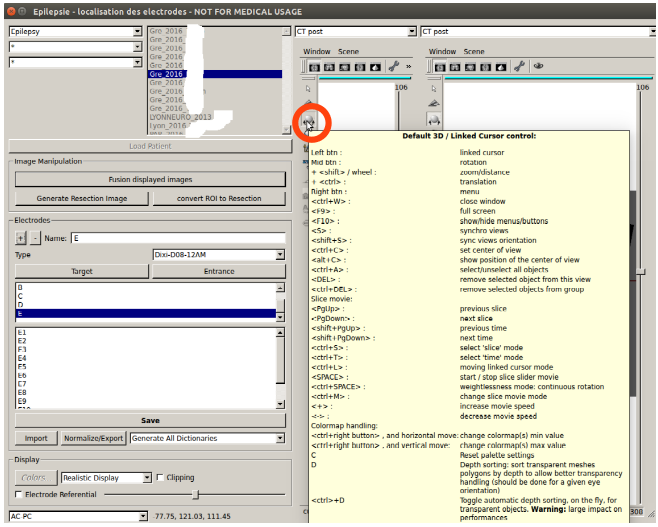
Quickly :
1b allows you to change the orientation (axial, sagital and coronal). The wrench icon allows to open the ROI GUI.
1c allows you to change the slice of the image displayed
1d lot of options. Allows you to rotate the image in 3D, to change the orientation the slice displayed, if you don’t want to stay in axial, sagital or coronal slice, you can rotate it to any orientation), to change the min and max of the colormap to increase or decrease contrast etc …
2 to 9 are made to generate the meshes of electrodes. You need of course to display in one of the anatomist windows an image in the « post » stage where you can see electrodes (CT or MRI post implantation) using image lists such as 1a. To add an electrode, start by 2 and then do 3, 4, 5 and 6 (no order for these ones).
2 add (+) or remove (-) an electrode. When you add one, it will take the name of the next unused letter (alphabetical order). You can change it later using 6.
3 validate the cursor position (click on the image to move the cursor) as the target position (deepest point of the electrode). Once clicked on it, it instantaneously updates the display of the electrode.
4 validate the cursor position as the entrance position (The software only uses this point for the direction, so as entrance point we often use the center of the screw as it’s more precise to define an orientation when both points are far away, but you can set the entrance point anywhere on the trajectory). Once clicked on it, it instantaneously updates the display of the electrode.
5 Select the model of the electrode curently selected in 7 (background blue). Once changed, it instantaneously update the display. Models availabe are the models set in the folder electrode_models in the folder of the protocol in the database brainvisa, example below :
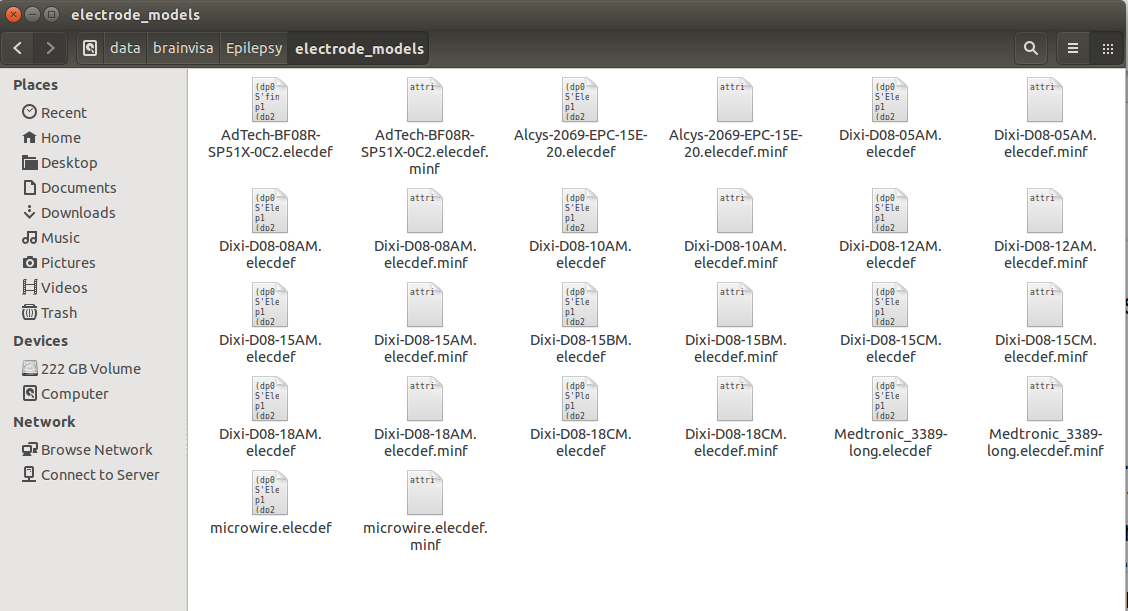 Models are made by IntrAnat Developpers, or now the GUI to
make new ones is not very easy to use, you can try it (it comes with
IntrAnat Electrodes) but better to ask to IntrAnat Developpers. If you
don’t have this folder in the database, you have to add it. Remember, to
add something in the database, you need to run BrainVisa and perform an
« update database » after adding files or directories (see page 13).
Models are made by IntrAnat Developpers, or now the GUI to
make new ones is not very easy to use, you can try it (it comes with
IntrAnat Electrodes) but better to ask to IntrAnat Developpers. If you
don’t have this folder in the database, you have to add it. Remember, to
add something in the database, you need to run BrainVisa and perform an
« update database » after adding files or directories (see page 13).
Models are referenced as name given by the compagny who built them.
6 Name that you want to give to the electrode. Change it and when you click outside of the editable name it will update it (on the image for example).
7 List of all electrodes already set. If you click on one, it set its background to blue and the contacts in the anatomist windows become red. If you double click on one, it set its background to blue and the meshes of the contacts in the anatomist windows become red AND it moves the cursor to the deepest contact of the electrode and updates the image slice (see example below). It both cases, click or double click, it updates the list of contacts in 8.
8 list of contacts of the electrode selected in 7. If you click on one, only the corresponding contact will be set in red, all others take back the « original color » (color when not selected, often it’s orange). If you double click on one, it does the same as simple click AND it update the cursor and image slice to the position of selected contact, see example below :
9 Save electrodes. Once you have saved them, the next time to load this patient electrodes will be displayed automatically. It generates a folder « implantation » in patient folder in the database. This button save implantation in « patient space », not in the MNI space.
10 you can import an implantation. For example if the implantation has been generated on an other computer and you want to import it on this computer.
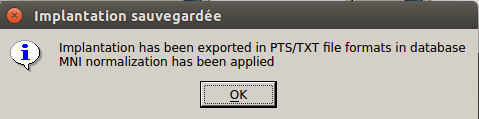
You can normalize and export: generate the MNI position of the electrodes (necessary for group studies and the use of groupDisplay).
It generates as well PTS and TXT files with electrodes names and position (in patient space and in MNI space if normalization is available). The files will be in the implantation folder of the patient. Once the process is done the following message box is displayed :
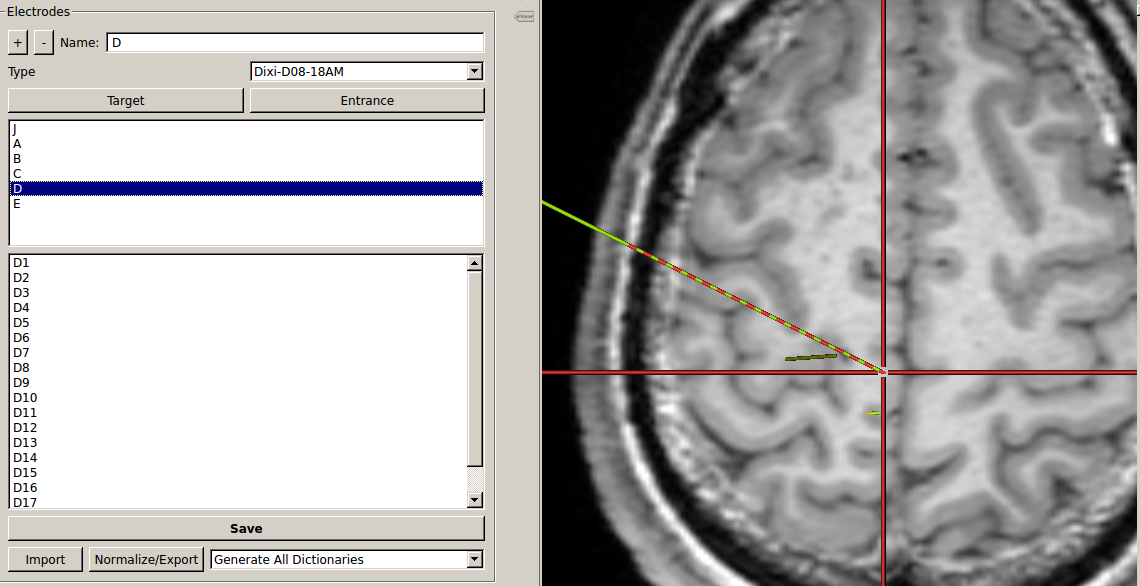
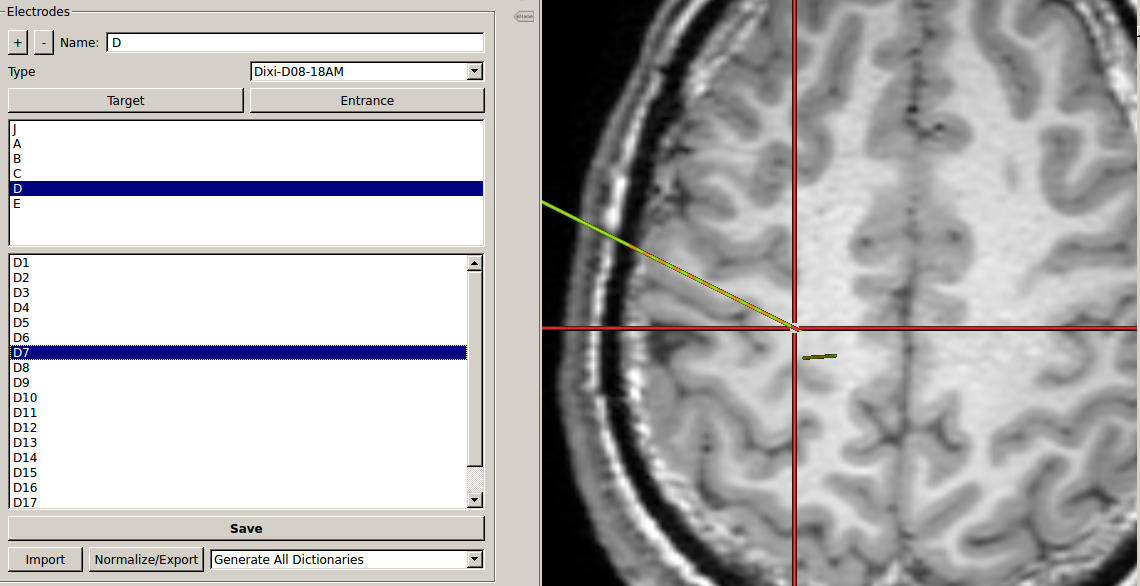
11 Change the display of the contacts. Two types of display :
-realistic display : The whole electrode is represented (contacts and parts between the contacts, as in figure above).
-x mm sphere display. Only contacts are represented, as below :
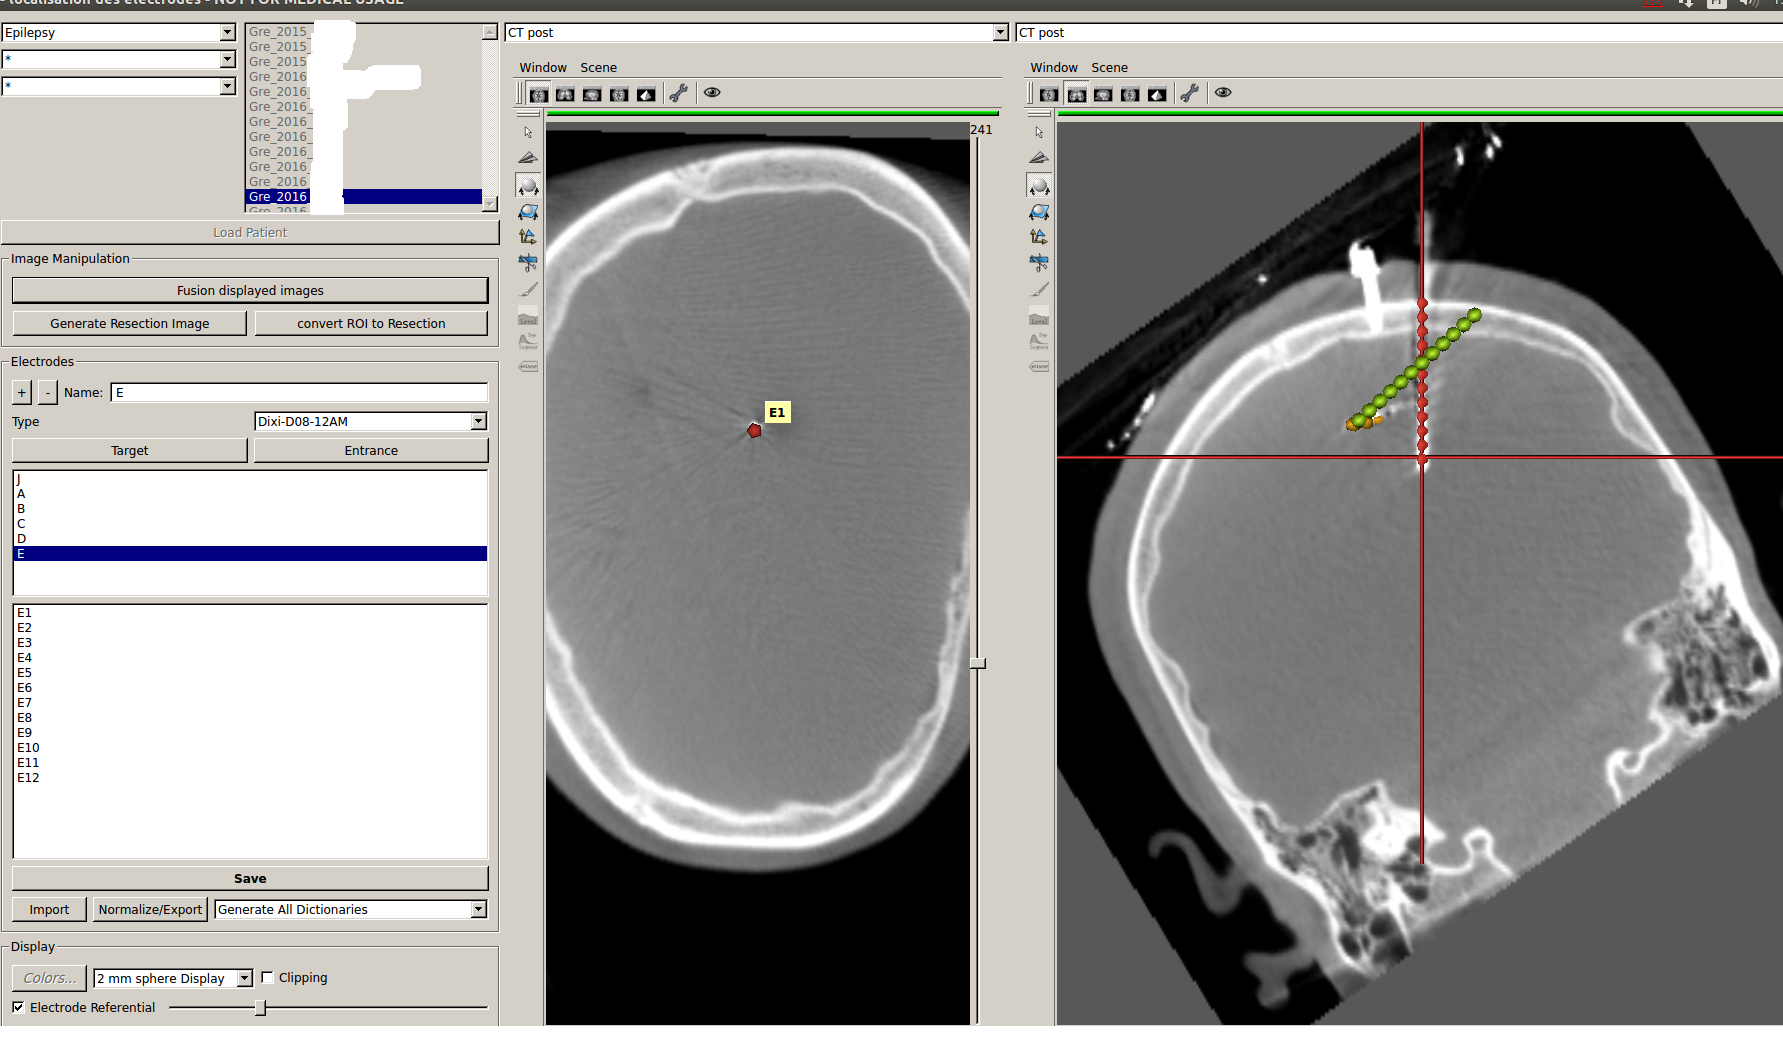
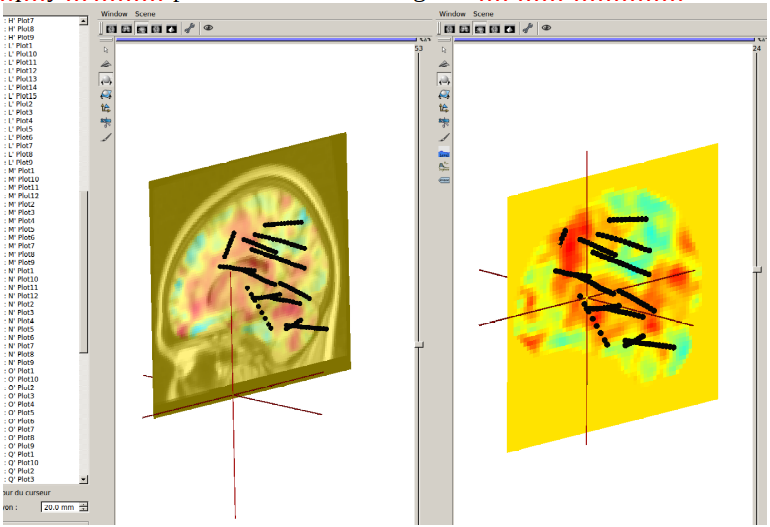
12 Change the referential. If unchecked you are in T1 pre Scanner-Based referential. If checked, the axial view is perpendicular to the electrode selected in 7. At the position of the contact selected in 8 if any, if not, the position of the deepest contact.
The electrode will be coplanar with sagital and coronal view.
Example below :
the electrode selected is E, display mode is 2 mm sphere, no « contact » selected so by default it’s has contact 1 is selected. The left anatomist window show a plan perpendicalur to the electrode, crossing the electrode in contact E1. The right anatomist window, set in coronal mode, show a plan coplanar with the electrode (centered). The contacts of the electrode are red as it is selected in 7 and no contact is selected in 8.
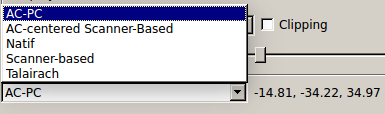
13 Change the referential in which the position of the cursor is given. Here the position of the cursor [-14,81 -34,22 34,97] is the position in the referential AC-PC.
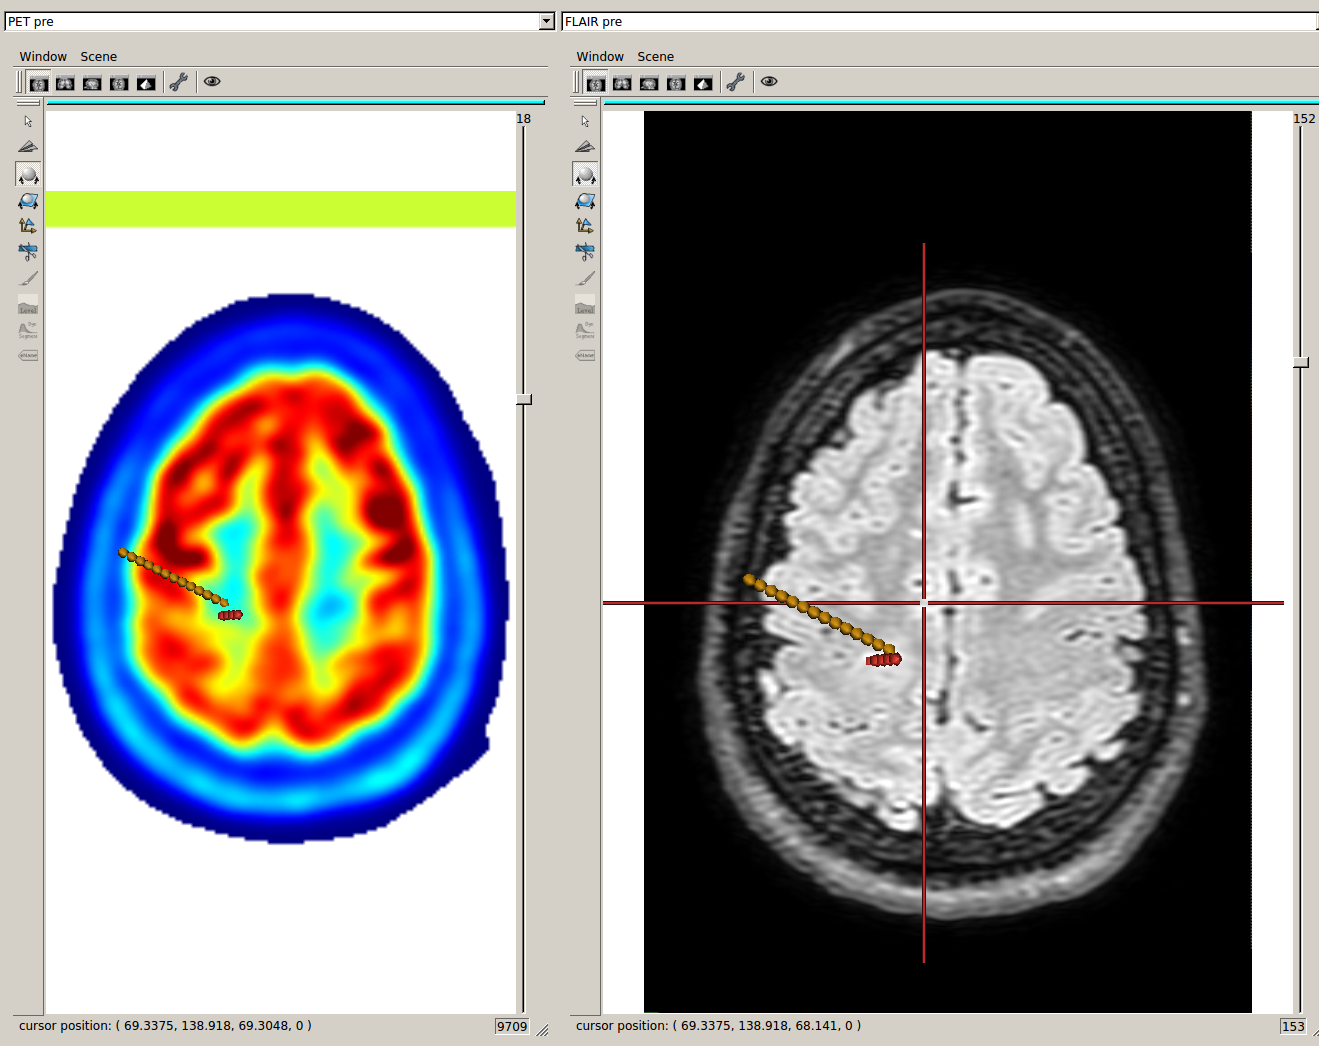
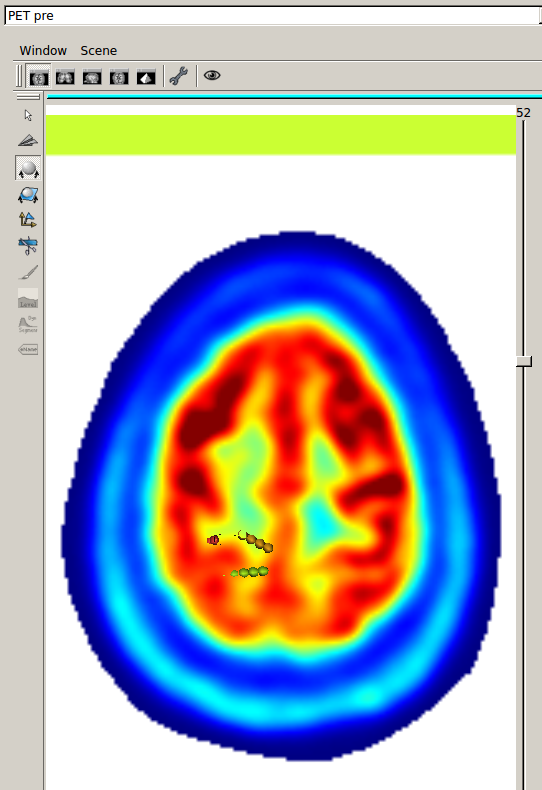
 14 Perform the fusion between the two displayed images.
If on the left anatomist window there is the PET and in the right
anatomist window there is the FLAIR, as below :
14 Perform the fusion between the two displayed images.
If on the left anatomist window there is the PET and in the right
anatomist window there is the FLAIR, as below :
 and if you click and fusion displayed image, in the right
anatomist window will be displayed the fusion as below:
and if you click and fusion displayed image, in the right
anatomist window will be displayed the fusion as below:
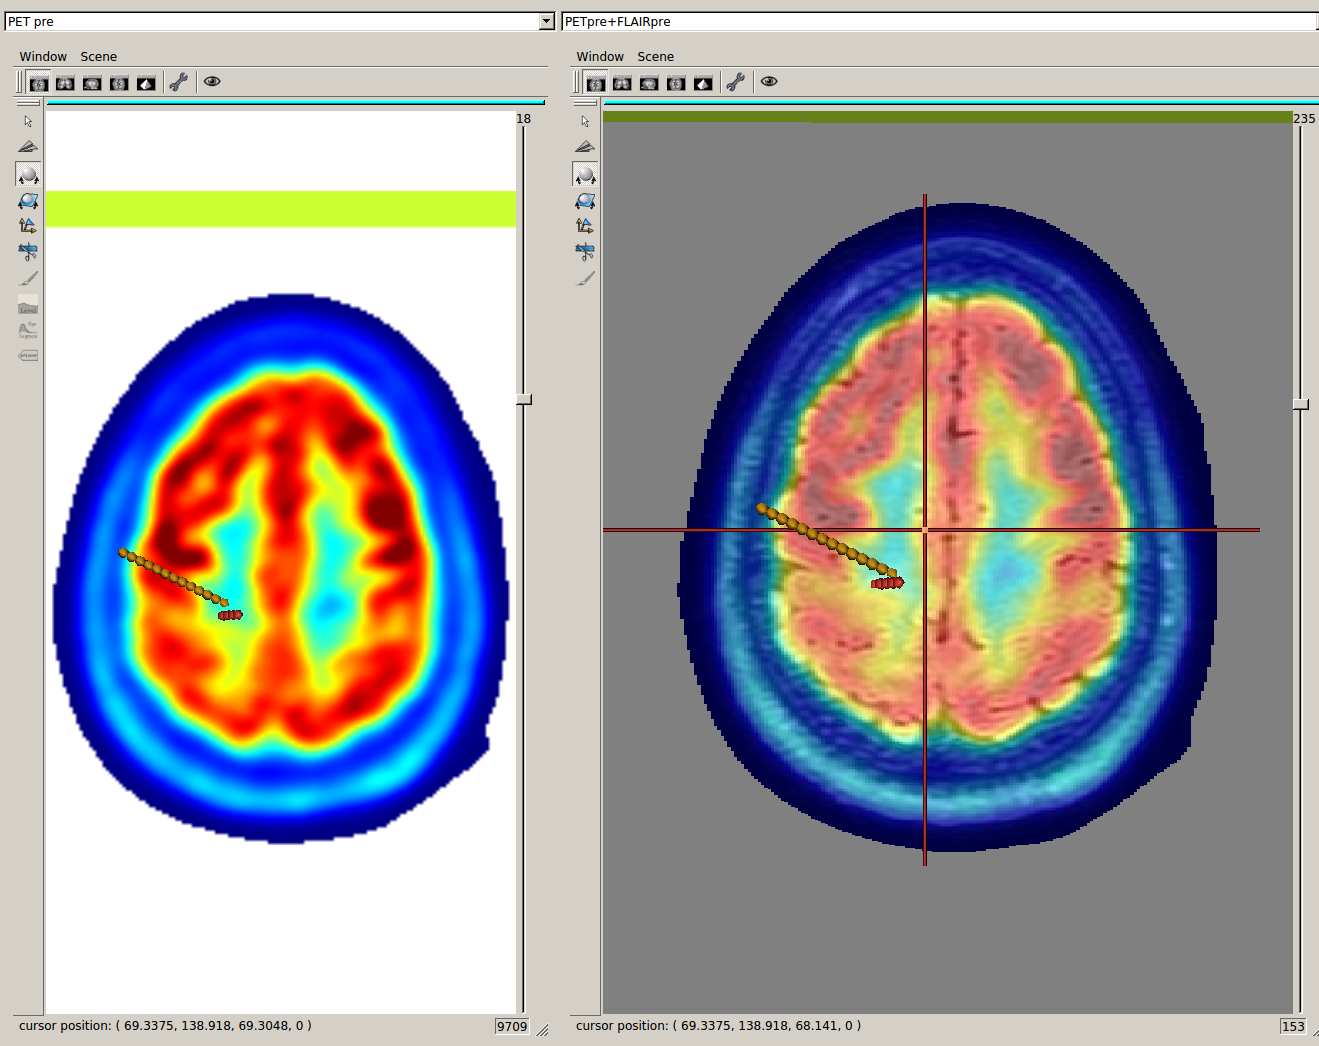 In the corresponding list of image appear « PET + FLAIR »
(image which was on the left + image which was on the right). You can
using this list change to another image and come back to this fusion.
The fusion is not saved in database to allow computers having just
« reading rights » and no « writing write » on the database to perform
the fusion. So if you close locateElectrodes, you’ll have to perform the
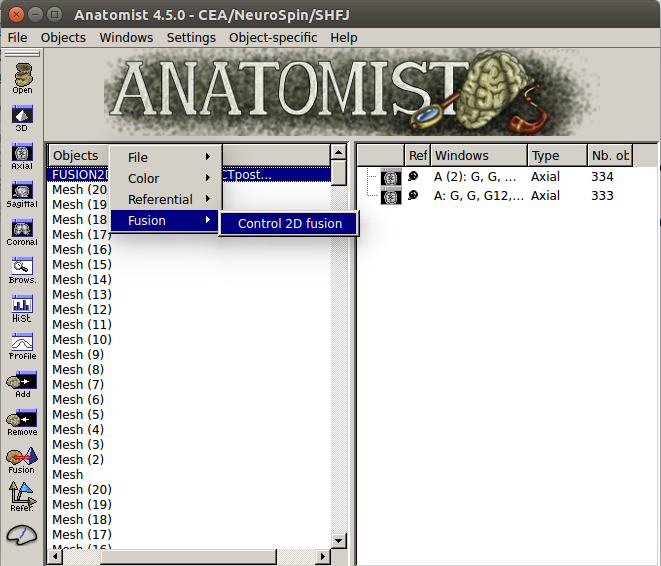
fusion again if wanted. To control the mixing rate between both images,
you have to go in the anatomist GUI, right click on the object name
FUSION2Dxxx and the click on Fusion->Control 2D fusion as shown below.
In the corresponding list of image appear « PET + FLAIR »
(image which was on the left + image which was on the right). You can
using this list change to another image and come back to this fusion.
The fusion is not saved in database to allow computers having just
« reading rights » and no « writing write » on the database to perform
the fusion. So if you close locateElectrodes, you’ll have to perform the
fusion again if wanted. To control the mixing rate between both images,
you have to go in the anatomist GUI, right click on the object name
FUSION2Dxxx and the click on Fusion->Control 2D fusion as shown below.
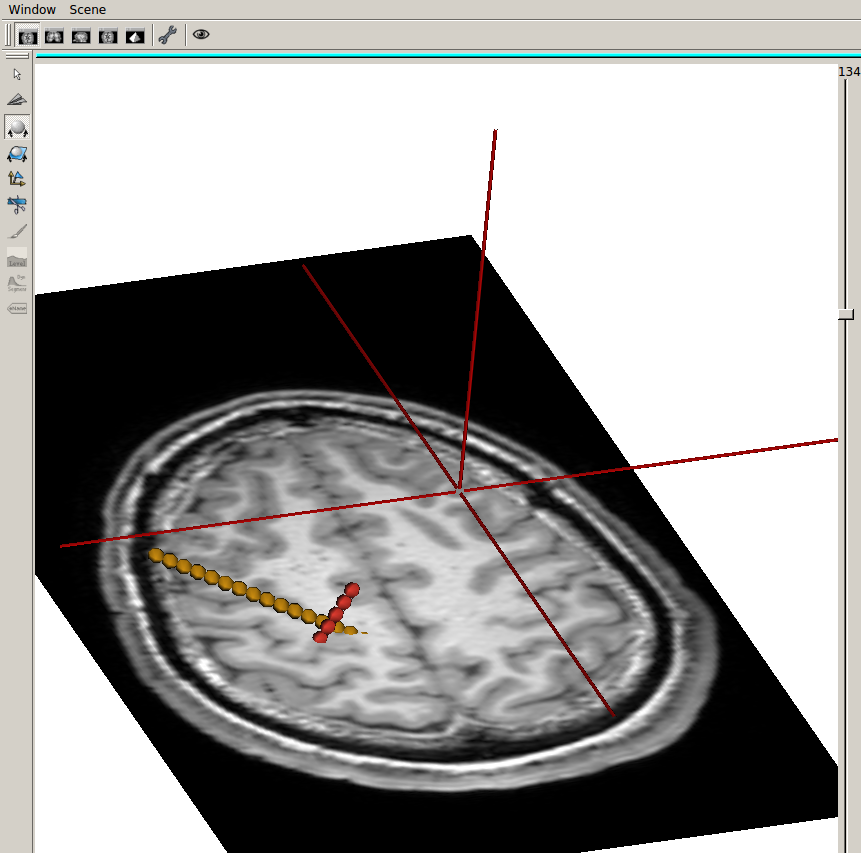
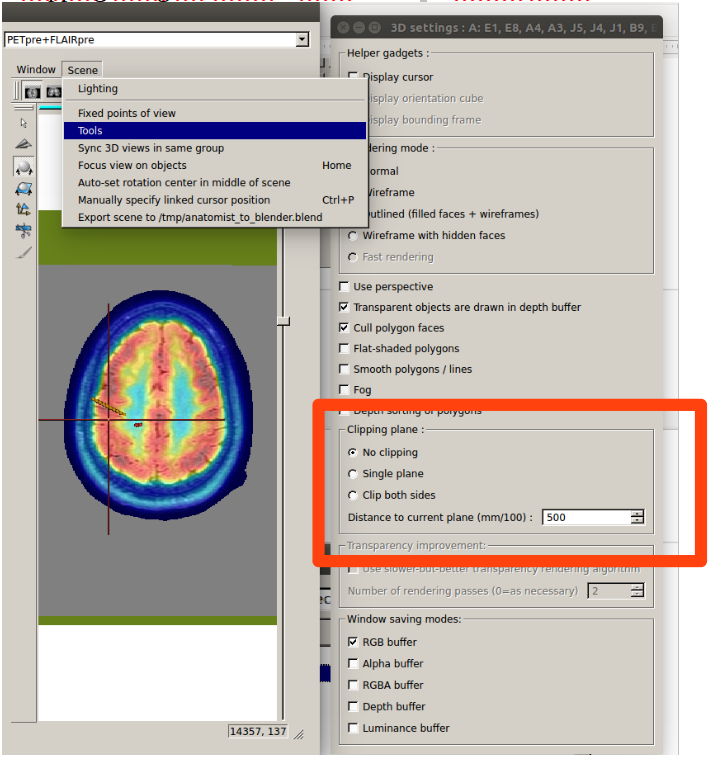
15 Clipping : does not display the meshes « too far » from the slice displayed (± 5 mm). Useful to avoid mistaking the position of a contact. For example in the case below, on the left there is no clipping, on the right there is. On the left, without the clipping, contact D16 could be « seen » as in hypoactivity, althought it is far away from the displayed slice, it’s corresponding to a slice way lower. Meshes are 3D objects, slices 2D, please remember that.

The clipping checkbox clips only meshes on the left anatomist window. But each anatomist window can be set with a clipping using the Scene->Tools menu as shown below :
16 : BrainVisa ROI Toolbox. This toolbox is not made by IntrAnat Developpers but by Anatomist Developpers. You can find some information here : http://brainvisa.info/anatomist/user_doc/anatomist_tutorial.html, here : http://brainvisa.info/anatomist/user_doc/anatomist_manual2.html, and here : http://brainvisa.info/axon/en/processes/ROIDrawing.html
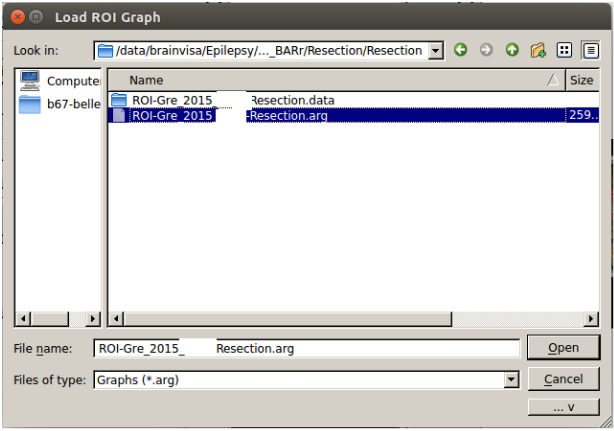
It is useful for example when the Resection estimation didn’t work very well and you have to perform manual correction. Once the resection algorithm has finished, if you want to correct the result, open the roi toolbox (wrench icon). The following GUI will open, with the list of available images for the current patient. You then have to open the ROI made by the resection algorithm, go to Session->Open
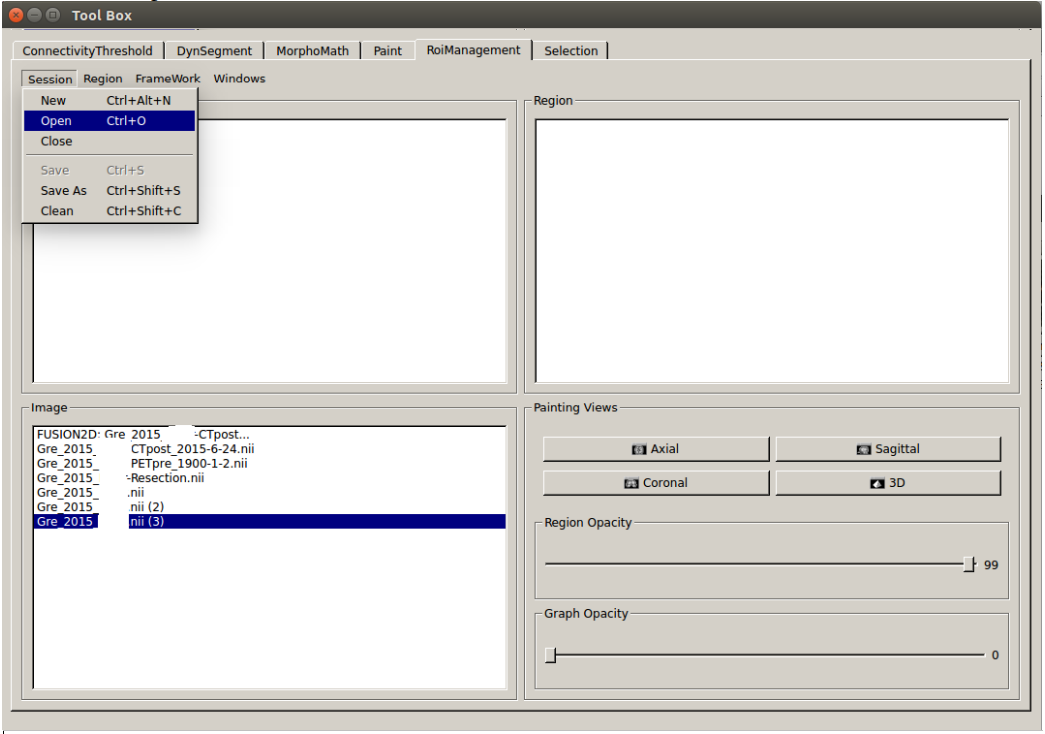 Then look for the file ROI-SubjectName-Resection.arg and open
it. It will be in the
Then look for the file ROI-SubjectName-Resection.arg and open
it. It will be in the
/BrainVisaDatabase/Protocol/PatientName/Resection/Resection
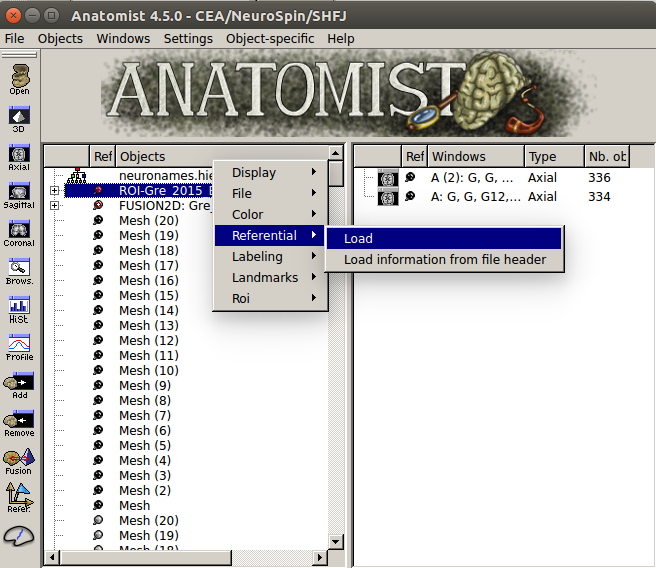
 Once it has been loaded, you have to set the referential in
which has been made the ROI. The referential is always T1pre native but
it doesn’t load this information by default.
Once it has been loaded, you have to set the referential in
which has been made the ROI. The referential is always T1pre native but
it doesn’t load this information by default.
In the anatomist GUI, right click on the ROI, then referential>Load. The name of the referential should be t1mri_t1pre….native. The referential in anatomist are identified by the color of the sphere on the left of the object name in the anatomist GUI. All object/images generated from the T1pre acquisition should have the same color (T1pre, Rhemi, Lhemi, ROI, Rwhite, Lwhite, etc), that should one of the most common color.
Then in the ROI toolbox GUI you can select the paint tab :
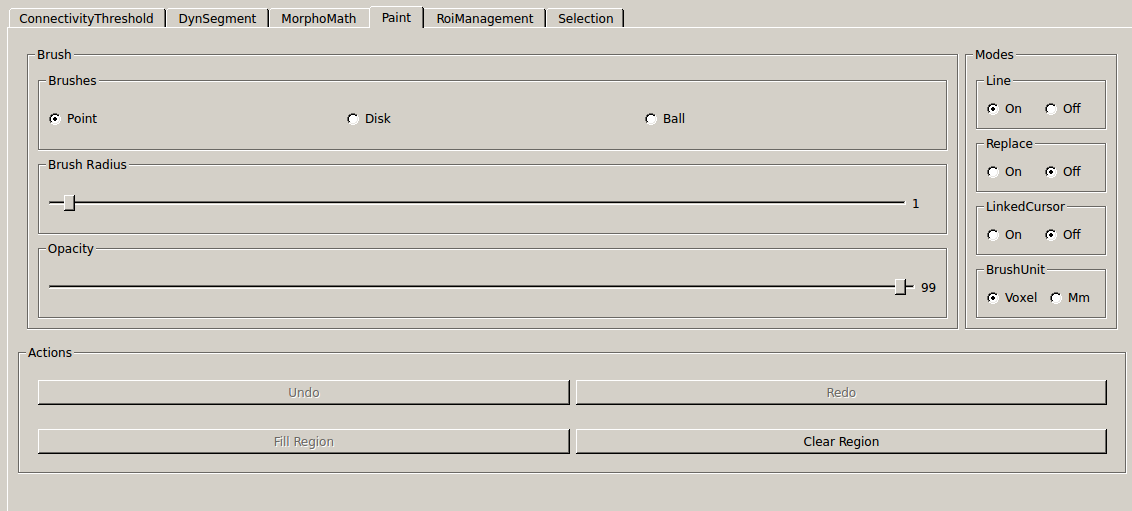 and modify the ROI. Left click to add area to the ROI,
ctrl+left click to remove area from the ROI.
and modify the ROI. Left click to add area to the ROI,
ctrl+left click to remove area from the ROI.
For the resection, once the modification done, you have to convert the ROI into an Image by clicking on 18.
All calculation of resection volume, overlap of the resection with MarsAtlas or Freesurfer Atlas parcels are done on the Resection Image and not the Resection ROI. The ROI is there only to make manual correction. So DON’T FORGET TO CONVERT THE ROI INTO IMAGE !!!!
17: Generate the resection image and ROI automaticaly by subtracting the brain mask of the T1postOp with the brain mask of the T1pre. If the T1postOp has not been imported, it doesn’t do anything, but for now it doesn’t display any error/warning message either. Once the resection calculation is done, it will automaticaly show the resection image in the right anatomist window.
The resection is added in the patient folder
/BrainVisaDatabase/Protocol/PatientName/Resection/Resection
19: Generate dictionnaries :
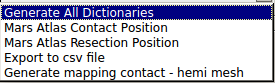 Generate All Dictionaries will generate all « options » in
the displayed order. Otherwise it will generate only the selected one.
Generate All Dictionaries will generate all « options » in
the displayed order. Otherwise it will generate only the selected one.
For now you have to perform the Mars Atlas Contact Position to be able to perform the others. (will change « soon »).
These dictionaries are useful for group studies, in groupDisplay you can select all patients having a contact in xxx parcel, or having a resection in xxx parcel. See part on groupDisplay.
-Mars Atlas Contact Position and Resection Position generate json files containing python dictionaries.
For the contact position, in the patient folder, in Implantation, the file generated is PatientName.eleclabel. If you open it you will see a python dictionaries with different keys (for now plots_label and plots_label_bipolar).
For each contact or bipole center it says if it is in the Grey or White matter, in which MarsAtlas parcel, if the contact was in the part of the brain resected (for now. Soon destrieux atlas and hippocampus subfield atlas will be included as well)
example below :
{“plots_label”: {“L09”: {“MarsAtlas”: [0, “not in a mars atlas parcel”], “GreyWhite”: [0, “not in brain matter”], “Resection”: [0, “not in resection”]}, “L08”: {“MarsAtlas”: [0, “not in a mars atlas parcel”], “GreyWhite”: [255 “Whitematter”], “Resection”: [0, “not in resection”]}, “L07”: {“MarsAtlas”: [127, “R_PMdm”], “GreyWhite”: [100, “Greymatter”], “Resection”: [1, “in resection”]}, “L06”: {“MarsAtlas”: [127, “R_PMdm”], “GreyWhite”: [100, “Greymatter”], “Resection”: [1, “in resection”]}, etc ….. }
Contact L09 is not in grey or white matter (possibly in the skull, ventricles, …), not in a recognized MarsAtlas parcel, not in the resection.
Contact L06 is in the Greymatter, in the MarsAtlas parcel called R_Pmdm, and in the part of the brain which as been removed.
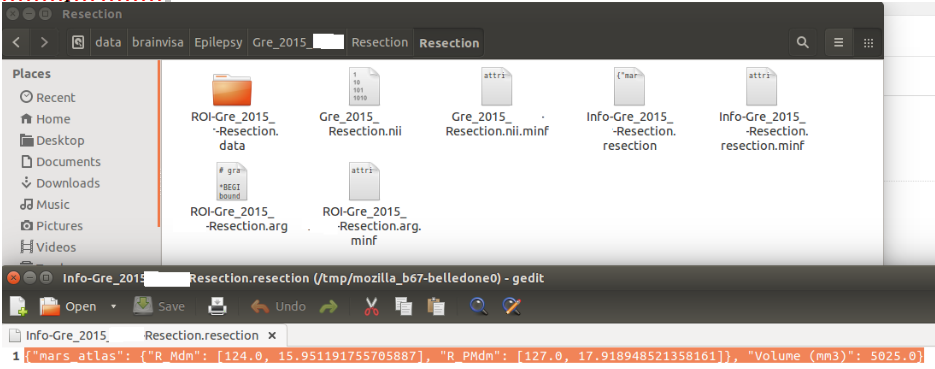
For the resection, n the patient folder in Resection/Resection, the file generated is Info-PatientName-Resection.resection. If you open it you will see a python dictionary with different keys (for now only mars_atlas and volume but soon Destrieux atlas and hippocampus subfield atlas as well).
Volume is the total volume of the resection in mm³.
In mars_atlas, you have the name of the parcel concerned by the resection, here R_Mdm and R_PMdm (see http://www.ncbi.nlm.nih.gov/pubmed/26813563 for full name), the value of the index corresponding to the parcel on the nifti file of MarsAtlas parcels, and the percentage of the parcel that has been resected. Careful it’s a rough estimation of the percentage. We haven’t yet performed an estimation of the accurancy of this percentage but it’s a really rough approximation.
Example below :
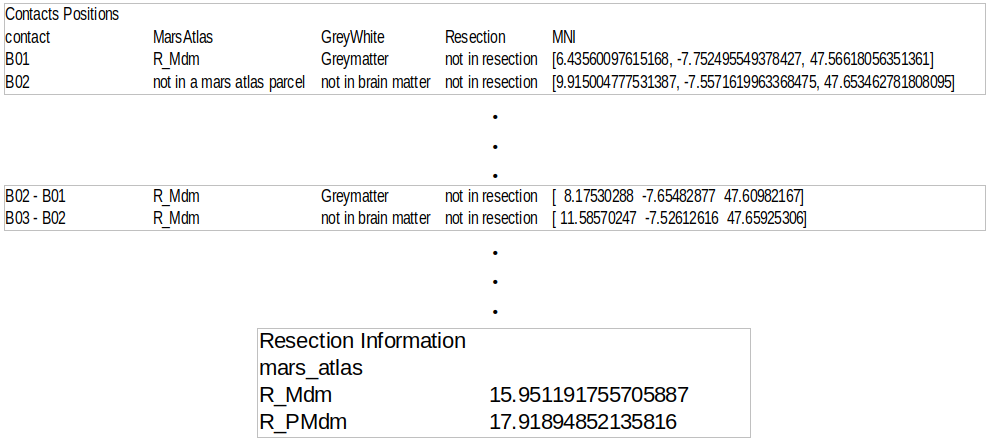
-Export to csv convert the json files of contat position and resection position as a csv file (more readable for matlab and excel users for example). The file is located in database/protocol/patientname/implantation/patientname.csv
At the begining of the file there are information on contact, then on bipole center and then on the resection, as below :
-Generate mapping contact – hemi mesh generates a file containing, for all electrode contacts, the distance to every vertex of the cortex mesh. Useful when you want to project sEEG data/analysis on the cortex. For each contact you will be able to project the data on all vertex within x mm around the contact, give a weight of the data depending on the distance to the vertex etc … and then generate a texture on the mesh to visualize all that on the software.
groupDisplay
groupDisplay is the GUI to visualize all data in the MNI referential.
This interface is evolving a lot so for now it can be a little tricky to use.
There are two tabs, Subjects and Plots.
Subjects is a data filtering interface, to select only few patients on the whole database.
Plots is the display of chosen patient contacts on images in the MNI referential.
 For now its main use has been to show that implantation of
subjects have covered correctly some structures. To compare with group
study fMRI, when you have the fMRI results of a group study in the MNI,
you can look for patients who had contacts where a statistical test on
fMRI studies was significant.
For now its main use has been to show that implantation of
subjects have covered correctly some structures. To compare with group
study fMRI, when you have the fMRI results of a group study in the MNI,
you can look for patients who had contacts where a statistical test on
fMRI studies was significant.
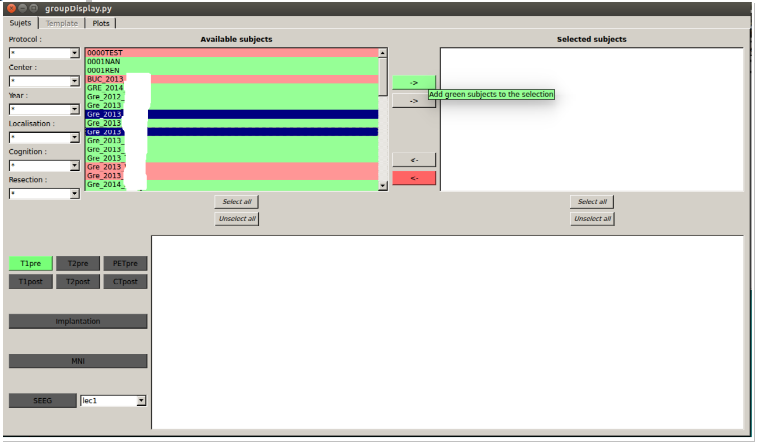
Tab : Subjects
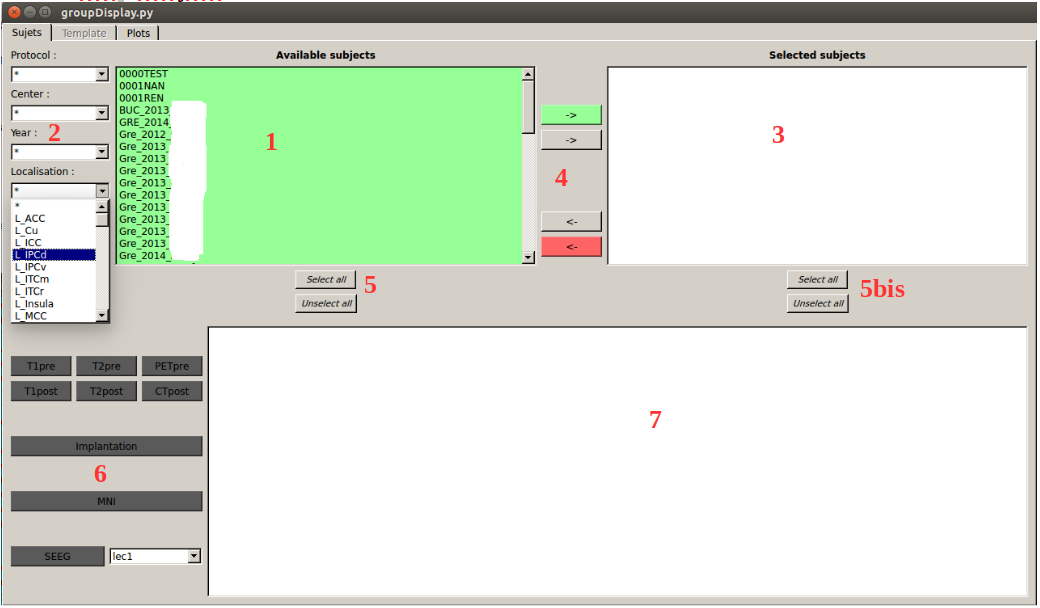
1 List of all patients available according to the filter in 2 (Protocol, Center, Year, Localisation, Cognition (in development), Resection)
2 Filters (to not scroll over the full list). In 1 there will be only :
-Protocol : patient who are included in the selected protocol (specified in ImageImport)
-Center : patient who have been affiliated to the selected center (on ImageImport)
-Year : patient who have been affiliated to the selected year (on ImageImport)
-Localization : patient who have at least one contact in the selected MarsAtlas parcel (in development, same with Destrieux parcels from Freesurfer)
-Cognition : patient who performed the selected cognitive task (in development)
-Resection : patient who had a resection including at least a part of the selected MarsAtlas parcel (in development, same with Destrieux parcels from freesurfer)
for all of them, the symbol « * » means that no filter is applied.
3 List of selected patients (patients who will be manageable once in the tab Plots). To move a patient from 1 to 3, use 4.
4 From the top to the bottom (if you leave the mouse on one of these buttons without clicking, explanation will appear, as on figure below)) :
Arrow to the right, background green : add green subjects to the selection
Arrow to the right, background gray : add selected subjects to the selection
Arrow to the left, background gray : remove selected subjects from the selection
Arrow to the left, background red : remove red subjects from the selection
example image below :
 subject with blue background will be transfered in the list
of selected subjects using the arrow to the right, gray background.
subject with blue background will be transfered in the list
of selected subjects using the arrow to the right, gray background.
Subject with green background will be transfered in the list of selected subjects using the arrow to the right, green background.
5 and 5bis : select and unselect all subjects of the list of available subjects and selected subjects respectively.
6 Highlight with green background all subjects having the selected item in the available list and selected list, with red background all subjects who haven’t. In order to potentially transfert them in the selected list using the arrow to the right, green background. In the example above, all subjects having a T1pre are highlighted with green background.
It works as logical and operator, if you select T1pre and CTpost for example, only subjects having a T1pre AND a CTpost will be highlighted with a green background.
7 No idea what it is for.
Tab : Plots
When you click on Plots, it will try to generate the mesh objects of each contacts of all patients, so it needs the MNI position. If the MNI position haven’t been generated on locateElectrodes, it will show this error message :
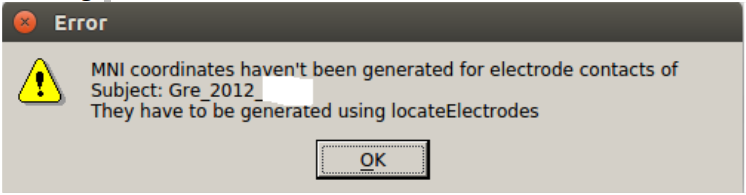 It won’t stop, it will continue to generate the mesh of the
contacts of the other patients selected. It’s just a warning that this
patient won’t be generated. (it stops the process until you click on
ok).
It won’t stop, it will continue to generate the mesh of the
contacts of the other patients selected. It’s just a warning that this
patient won’t be generated. (it stops the process until you click on
ok).
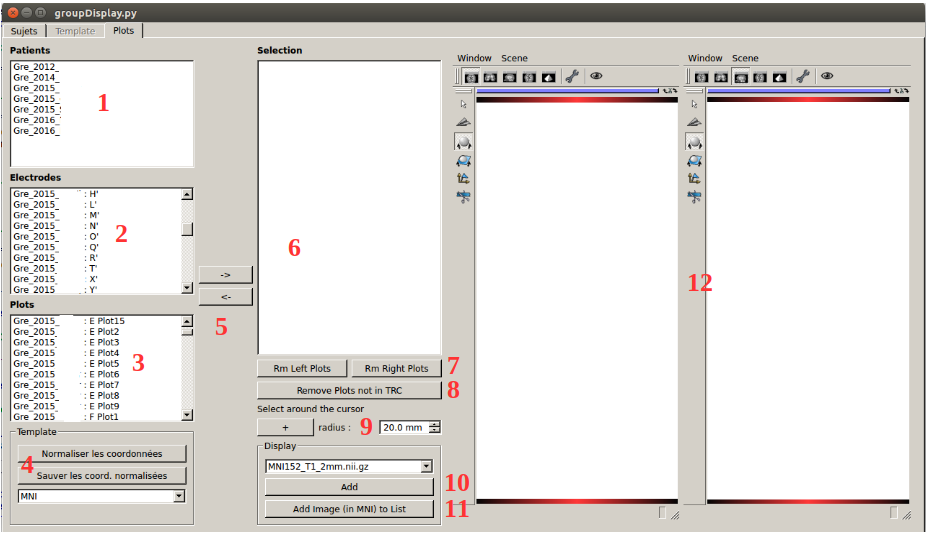
1 List of patient selected in the Subjects tab (even if there was no MNI position for the contacts)
2 List of electrodes for all patients (so if you had an error message because the MNI position of the contacts were not calculated for a patient, they won’t appear here)
3 List of all contacts for all patients (so if you had an error message because the MNI position of the contacts were not calculated for a patient, they won’t appear here)
4 Useless for now. The buttons will allow to generate MNI position for patient for who it haven’t been made in locateElectrodes.
5 Add or Remove selected items. If you select an electrode in 2, it will add all contacts of the electrode. If you select a patient in 1 it will add all contacts of all patients. If you select only one contact, it will add this contact.
6 List of all contacts displayed
7 Remove left or right plots (in MNI, negative or positive value in x)
8 Remove contacts which haven’t been recorded on the sEEG for the corresponding patients, if SEEG was imported in ImageImport (for now it accepts only Micromed .TRC format, but we use the neo toolbox so it is easily adaptable to any format read by neo https://github.com/NeuralEnsemble/python-neo).
9 Select all plots in a sphere which has the cursor as center and of a radius of x mm (here 20 mm)
10 add the selected image (from the list, here it’s MNI152_T1_2mm.nii) in the anatomist windows in 12. To be coregistered with plots, the image has to be in the MNI referential.
11 Add an image to the list, to be able to select and display it in the anatomist window. By default the list contains only the images in the MNI that contain the folder SPM12
12 anatomist windows (http://brainvisa.info/anatomist/user_doc/anatomist_manual1.html), see parts before (ImageImport or locateElectrodes).
Electrode Model Editor
Adding a new electrode model
BIDS compatibility
Importing from a BIDS database
Exporting to a BIDS database